Financial Highlights
(Extracted from Annual Report 2022)
Profit and Loss ($'Million)
| Financial Year Ended 30 June | 2022 | 2021 | 2020 | 2019 | 2018 |
|---|---|---|---|---|---|
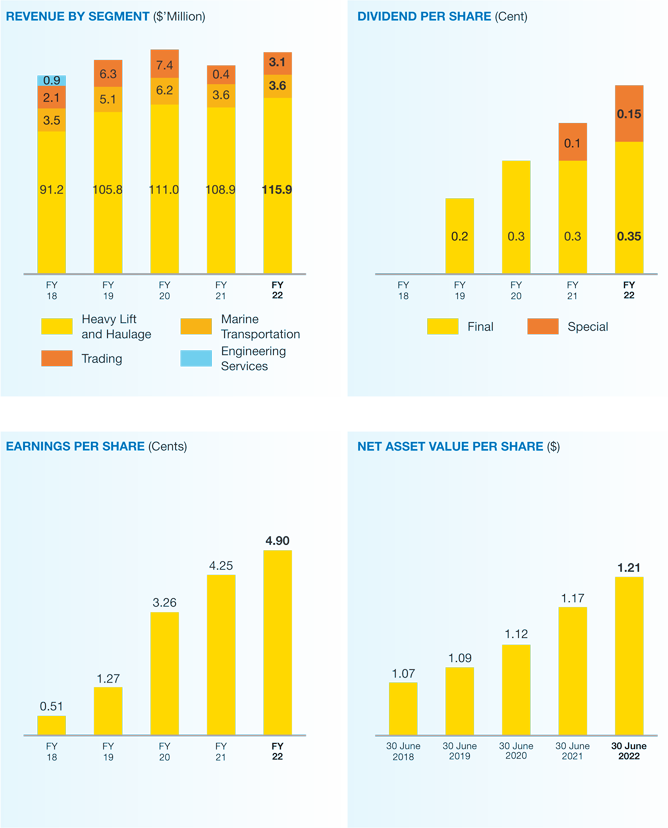
| Revenue | 122.6 | 112.9 | 124.7 | 117.2 | 97.7 |
| Gross Profit | 49.3 | 42.4 | 43.0 | 35.2 | 25.4 |
| GP Margin | 40.2% | 37.6% | 34.5% | 34.5% | 26.0% |
| Profit/(Loss) before Tax (PBT) | 16.4 | 13.8 | 12.2 | 5.8 | 1.4 |
| Profit/(Loss) after Tax (PAT) | 11.3 | 9.8 | 7.5 | 2.9 | 0.9 |
| Profit/(Loss) Attributable to Equity holders of the Company | 11.4 | 9.9 | 7.6 | 2.9 | 1.2 |
Balance Sheet ($'Million)
| As At 30 June | 2022 | 2021 | 2020 | 2019 | 2018 |
|---|---|---|---|---|---|
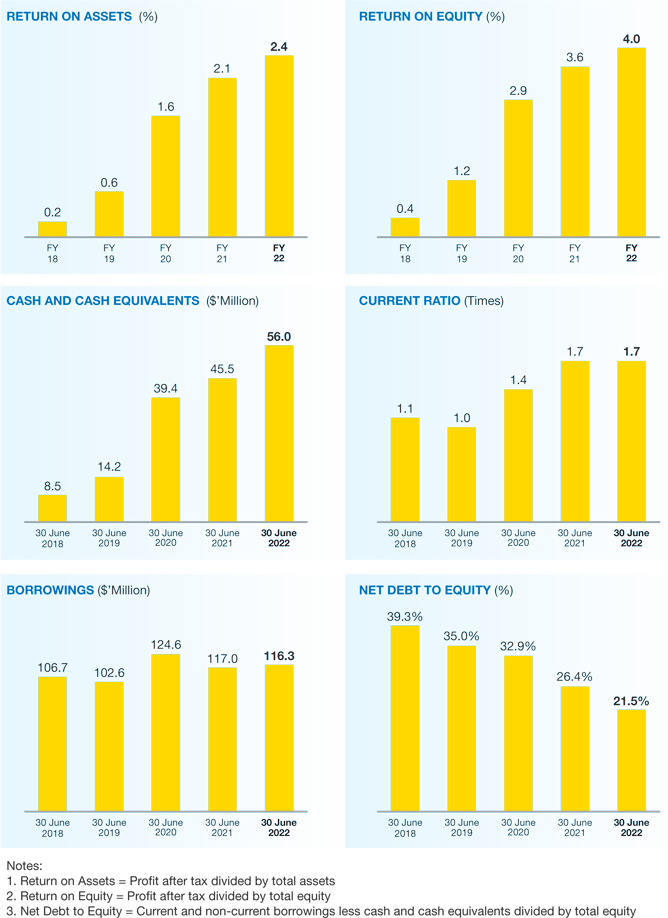
| Current Assets | 111.9 | 96.6 | 82.8 | 72.6 | 54.5 |
| Non-Current Assets | 364.4 | 362.7 | 378.6 | 376.3 | 358.6 |
| Total Assets | 476.3 | 459.3 | 461.4 | 448.9 | 413.1 |
| Current Liabilities | 66.6 | 57.4 | 60.0 | 69.4 | 51.6 |
| Non-Current Liabilities | 128.8 | 131.0 | 142.1 | 127.0 | 111.8 |
| Total Liabilities | 195.4 | 188.4 | 202.1 | 196.4 | 163.4 |
| Net Assets | 280.9 | 270.9 | 259.3 | 252.5 | 249.7 |
| Net Assets Attributable to Equity holders of the Company | 280.9 | 270.9 | 259.2 | 252.3 | 249.5 |